User Defined Column Analysis
The User Defined Column Analysis window allows you to view and analyse the values in each of the user defined columns within the project.
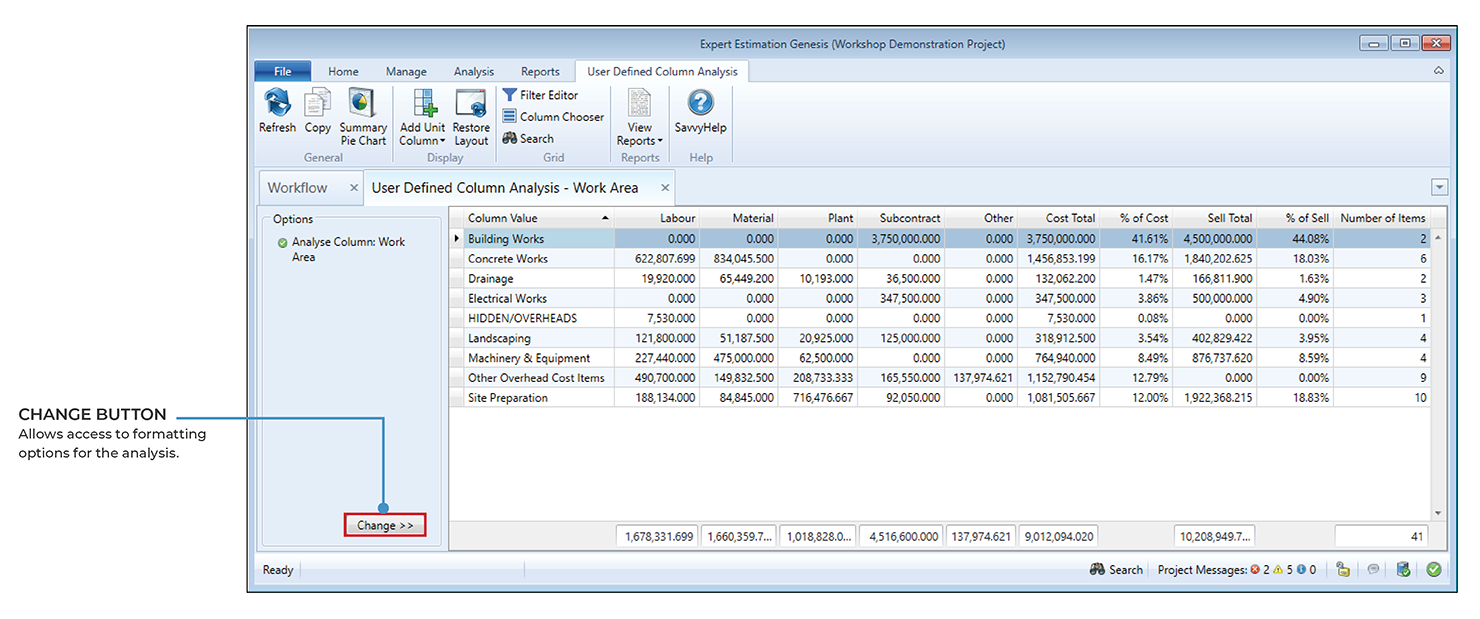
User Defined Column Analysis window
To select which column to analyse press the Change >> button and select the Schedule user defined column or Resource user defined column from the Analyse Column drop-down menu.
Note: If Resource user defined columns are selected, no sell values will be displayed.
The window displays a summary of cost information by:
- Resource type,
- Sell totals,
- Number of items.
You can also see this information as a pie chart by clicking the Summary Pie Chart (![]() ) button from the ribbon toolbar.
) button from the ribbon toolbar.
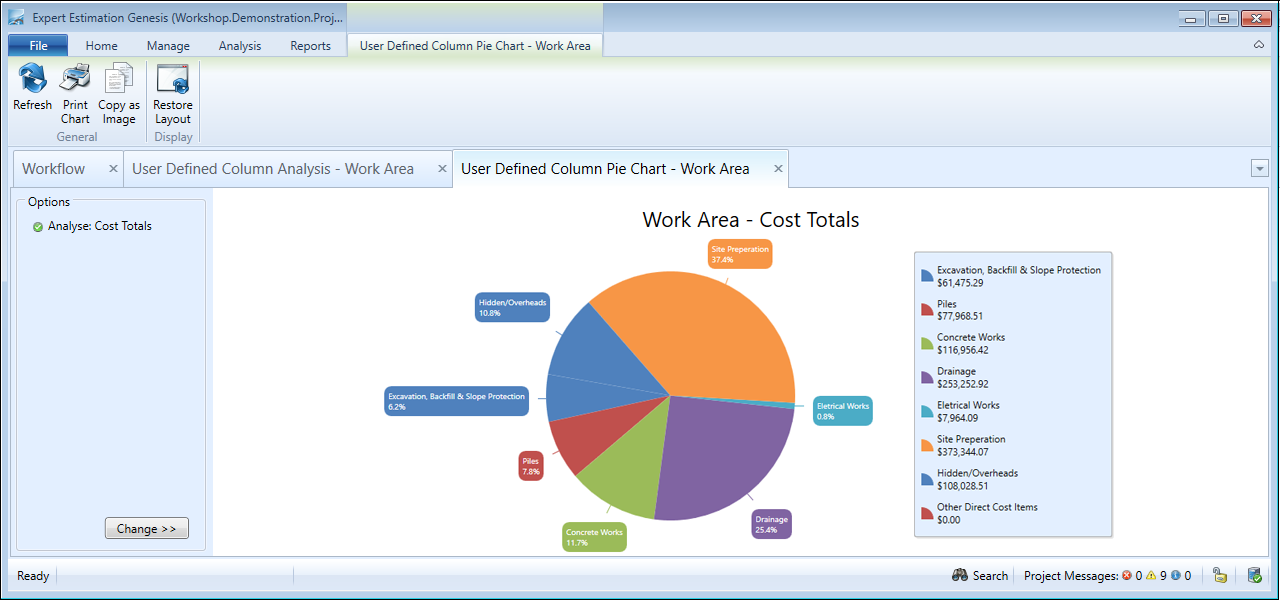
User Defined Column Analysis – Pie Chart window
FORMATTING OPTIONS
The formatting options allow you to specify which value to analyse. This area can be accessed by clicking the Change >> button, then selecting the data you wish to display in the pie chart, including:
- Cost Total,
- Sell Total,
- Resource Type.
This data is also referenced to produce the User Defined Column Report.