Resource Flow Analysis
Genesis edition only.
The Resource Flow Analysis window is used to display the use of Resources throughout the duration of the selected Cash Flow Scenario.
Dependent on the formatting of the analysis, information is presented per period either as a summary of the selected Resources, or the individual Resource amounts for each period.
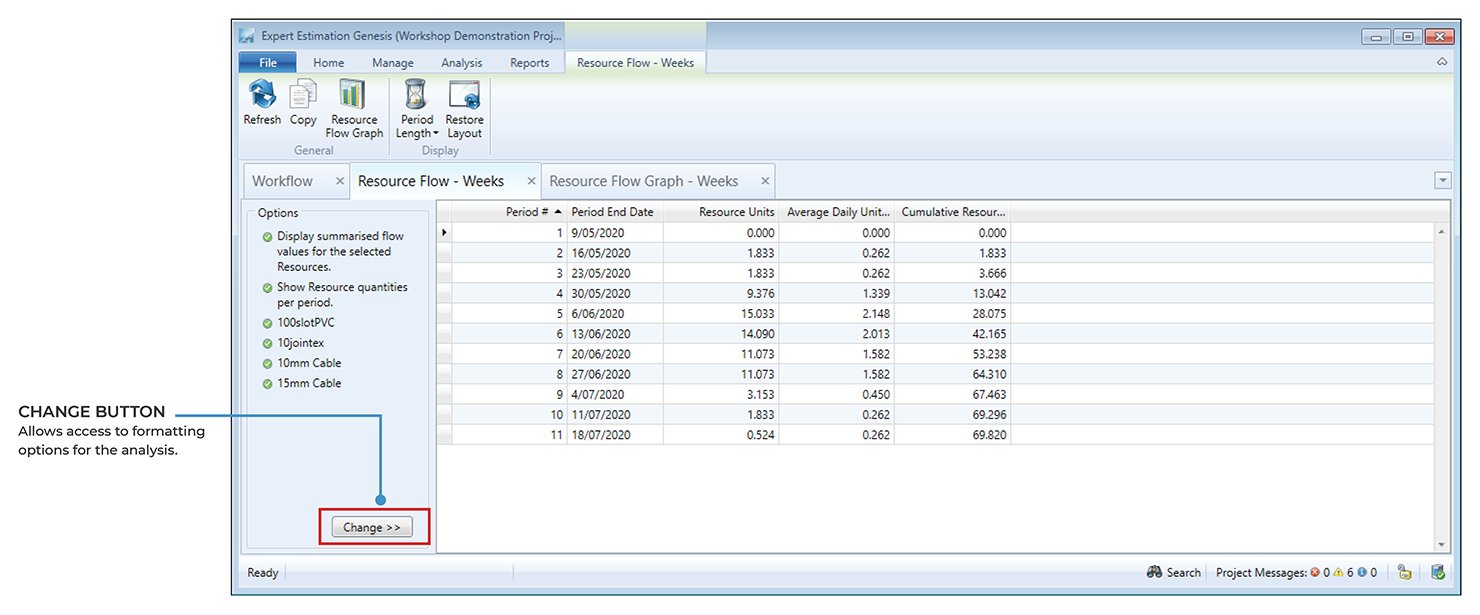
Resource Flow Analysis window
FORMATTING
You can change the format of the data by clicking the Change >> button, in the bottom left-hand corner in the Options section of the Analysis window.
By default, the analysis will appear empty until you select the resources you want to include in the analysis. This is performed by checking/unchecking the boxes next to each Resource Name from within the formatting panel.
|
OPTION |
DESCRIPTION |
|---|---|
|
Show Individual Resource Flow values |
This option allows users to view the usage (or value) of each selected Resource per period. If this option is not checked, a combined total of the selected Resource usages (or values) will be displayed. If this option is ticked then the Resource Flow Graph will be displayed as a line graph, if unticked it will be shown as a bar graph. |
|
Show Value Per Period (instead of Quantity) |
This option allows users to show the Resource Flow information as a value rather than a per unit amount. |
The analysis allows users to select the length of time (period) in which the Resource Flow Analysis will be displayed. The time periods available are days, weeks, fortnights, months, quarter years, half years or yearly.
RESOURCE FLOW GRAPH
After selecting the Resources to be displayed, the data displayed within the analysis can then be represented in a graph. To view the Resource Flow information as a graph, click the Resource Flow Graph button from the ribbon toolbar.
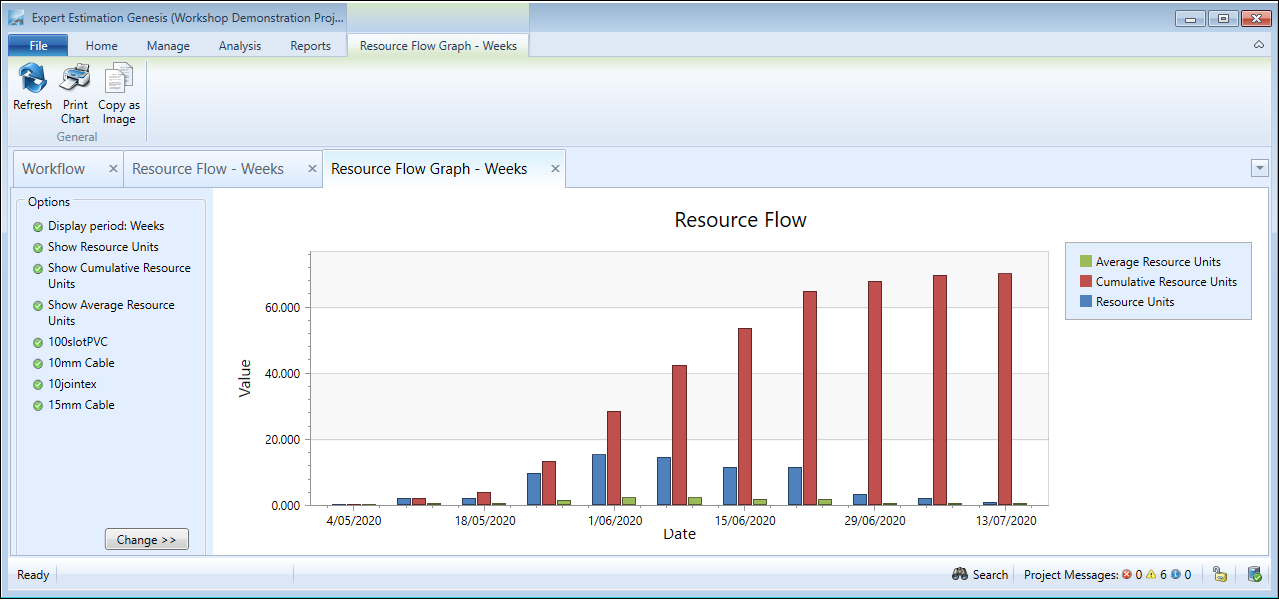
Resource Flow Graph
The style of the graph is dependent on the formatting of the Resource Flow analysis. By default data is graphed as a bar graph, however, if the option has been selected to display Individual Resource values, the graph will be styled as a Line graph.
Each style of the Resource Flow Graph has its own formatting options that can be applied.
BAR GRAPH FORMATTING
| OPTION |
DESCRIPTION |
|---|---|
|
Resource Units |
This option will show a data set on the graph that reflects the combined Resource usage (or value) of the selected Resources consumed per period. |
|
Cumulative Resource Units |
The Cumulative Resource Units option will display the cumulative Resource usage (or value) of the selected Resources to date for the period. |
|
Average Resource Units |
This data set will display the average Resource usage (or value) of the selected Resources per period. |
|
Displayed Period Length |
This option allows the selection of displayed time period for the graph. By default the graph will display data in the same period as the Resource Flow Analysis from which it was generated. |
LINE GRAPH FORMATTING
| OPTION |
DESCRIPTION |
|---|---|
|
Displayed Period Length |
This option allows the selection of displayed time period for the graph. By default the graph will display data in the same period as the Resource Flow Analysis from which it was generated. |
Selected Resources from the Individual Resource Flow Analysis can be hidden from the Resource Flow Graph. By default, all selected Resources are included on the graph. To hide a Resource, un-check the checkbox next to the Resource Name in the Resource Flow Graph legend.