Cash Flow Results Graph
Genesis edition only.
The Cash Flow Scenario Results can also be displayed in a customisable line graph format. Clicking on the Cash Flow Graph icon in the Cash Flow Results - Ribbon Toolbar will open the window, allowing for a default presentation to display Cash Flow data on a line graph.
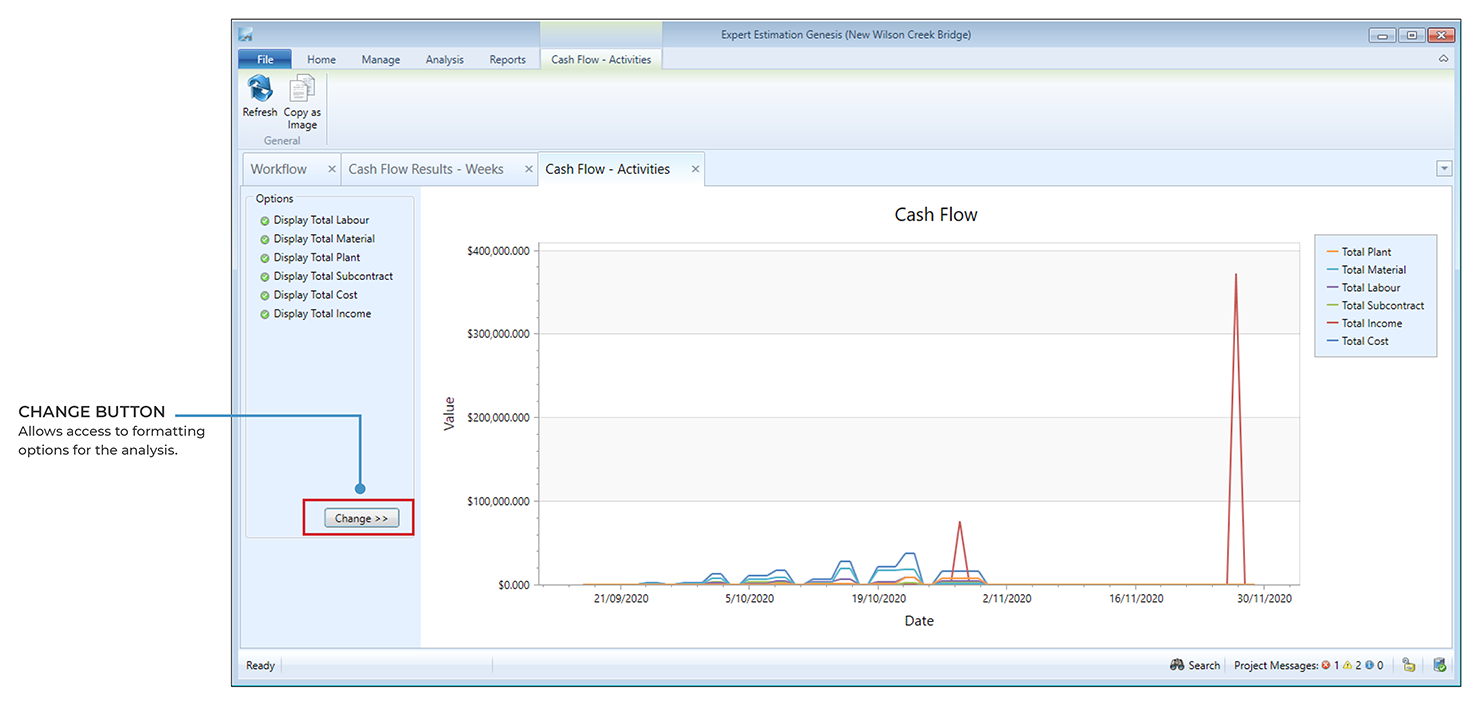
Cash Flow Results window – Graph
Modifying the displayed line graph data is performed by clicking the Change >> button, located in the bottom left-hand corner in the Options section of the analysis.
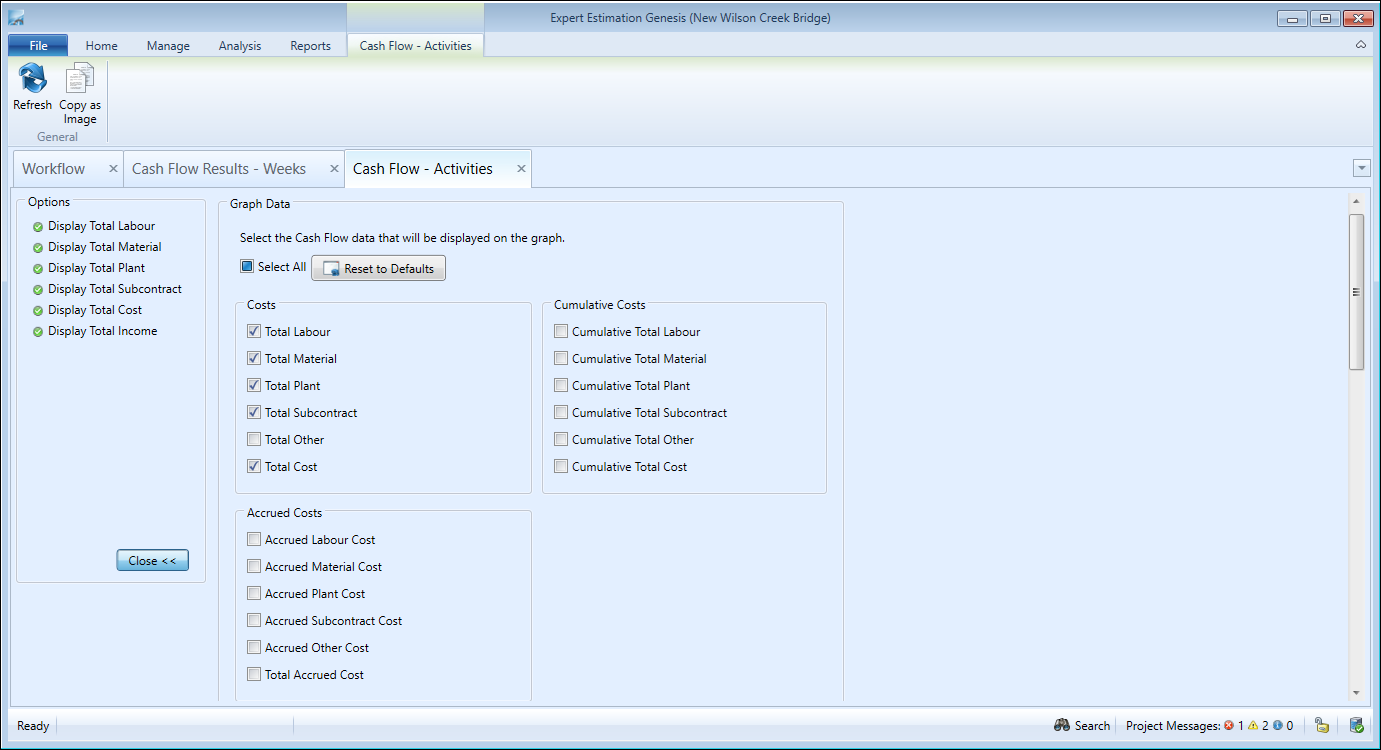
Cash Flow Results window – Graph Formatting
Clicking the Copy button in the Cash Flow Results Graph ribbon toolbar copies the graph detail as an image, ready for pasting into an external application.
CASH FLOW RESULTS - OPTIONS
An extensive range of options is presented for use on the Cash Flow Graph, allowing any data set seen in the Cash Flow Results window to be displayed on the Graph. These data sets display according to their associated categories. Further details about these are listed below.
COSTS
The costs for a Cash Flow Period represent the value that has actually been processed in a given period. This may reflect incurred cost of previous periods.
|
FORMATTING OPTION |
DESCRIPTION |
|---|---|
|
Total Resource Type Costs |
These options enable data points on the Cash Flow Results Graph, displaying the distribution of the Labour, Material, Plant, Subcontract or Other Cost Totals over time. The data point added is dependent on the Resource Types Totals that are selected. |
|
Total Cost |
This adds a new data point to the Cash Flow Results Graph, displaying the distribution of the Project’s Total Cost over time. |
Note: All data points available in the Cost section have an additional check-box available to display the cumulative value. These are located in the section called Cumulative Costs.
ACCRUED COSTS
Accrued Costs show the cumulative expenditure based on Incurred costs of previous periods and Cost Totals that have been processed for the current period. This amount displayed is the value that remains to be processed.
|
FORMATTING OPTION |
DESCRIPTION |
|---|---|
|
Accrued Resource Type Costs |
These options add a new data point to the Cash Flow Results Graph displaying the distribution of the Labour, Material, Plant, Subcontract or Other Accrued Cost Totals over time. The data point added is dependent on the Resource Type Accrued Totals that are selected. |
|
Total Accrued Cost |
This adds a new data point to the Cash Flow Results Graph, displaying the distribution of the Project’s Total Accrued Cost over time. This represents the amount of value (at any given point in time) a project has accumulated, determining whether the project is returning positive or negative results. |
INCURRED COSTS
This section of values represents the actual expenditure for a given period. While a Cost will not be included for a period in the Cost column where payment delays are in place, the Incurred Total will show the actual costs for a given period.
|
FORMATTING OPTION |
DESCRIPTION |
|---|---|
|
Incurred Resource Type Costs |
These options add a new data point to the Cash Flow Results Graph displaying the distribution of the Labour, Material, Plant, Subcontract or Other Incurred Costs over time. The data point added is dependent on the Resource Type Totals that are selected. |
|
Total Incurred Cost |
This adds a new data point to the Cash Flow Results Graph, displaying the distribution of the Project’s Total Cost over time. |
Note: All data points available in the Incurred Costs section have an additional check-box available to display the cumulative value. These are located in the section called Cumulative Incurred Costs.
ADVANCED/DEFERRED COSTS
|
FORMATTING OPTION |
DESCRIPTION |
|---|---|
|
Advanced/Deferred Costs |
Represents the value of Costs at a given point in time that have either been advanced from an upcoming period or deferred from a previous period within a Cash Flow lifetime. |
|
Total Cost Including Advanced/Deferred Costs |
This data point combines the current period’s Total Cost Value and the value of all Advanced/Deferred Costs that have been attributed to this given point in time. |
Note: All data points available in the Advanced/Deferred Costs section have an additional check-box available to display the cumulative value. These are located in the section called Cumulative Advanced/Deferred Costs.
INCOME
|
FORMATTING OPTION |
DESCRIPTION |
|---|---|
|
Claim Income |
Displays the total income claimed in any given Cash Flow period. This value may not necessarily match the Total Income data set in cases where income has either been accrued or deferred. |
|
Total Income |
Represents the total income of a Cash Flow period that has attributed to the Project. |
|
Accrued Income |
The Accrued Income data points represent the Total amount of income accrued within a period, including income that has been delayed from previous periods. |
Note: Both the Claim Income and the Total Income data points in this section have an additional check-box available to display the cumulative value. These are located in the section called Cumulative Income.
ADVANCED/DEFERRED INCOME
|
FORMATTING OPTION |
DESCRIPTION |
|---|---|
|
Advanced/Deferred Income |
Represents the Total Income for a period that has been Advanced from upcoming periods or Deferred from previous periods of a Cash Flow’s lifetime. |
|
Accrued Advanced/Deferred Income |
Represents the Total Accrued Income up to a period that has come from either Income Advances or Deferrals. |
|
Advanced/Deferred Claim Income |
Represents the Total Income for a period that has been claimed from income that has been either Advanced or Deferred. |
|
Accrued Income including Advanced/Deferred Income |
This data point represents the combination of the Total Accrued Income that has been either Advanced or Deferred up to a given period. |
|
Claim Income including Accrued Advanced/Deferred Income |
Reflects the claimed Income so far in a Cash Flow period, combined with the total income that has been accrued through Income Advances or Deferrals. |
|
Total Income including Advanced/Deferred Claim Income |
Represents a Cash Flow period’s Total Income combined with the Claimed Income from any Advances or Deferrals from future or previous Cash Flow periods. |
Note: All data points (except Accrued data) in the Advanced/Deferred Income section have an additional check-box available to display the cumulative value. These are located in the section called Cumulative Advanced/Deferred Income.
ACCRUAL
|
FORMATTING OPTION |
DESCRIPTION |
|---|---|
|
Accrued Total |
Represents the total Accrued value of the project for the period. This means that for any period you can see the accrued value owed (negative value) or is owed (positive value). |
|
Accrued Total including Accrued Advanced/Deferred Income |
Displays a period’s combined Accrual Total and Accrued Income that has been either Advanced or Deferred. |
SUMMARY
|
FORMATTING OPTION |
DESCRIPTION |
|---|---|
|
Period Delta |
Represents the difference between the Cost and Income Totals for a Cash Flow period. |
|
Period Delta including Advanced/Deferred Cost Income |
Represents the combined value of the difference between Cost and Income totals, and the Income that has been either Advanced or Deferred to the current period. |
|
Cumulative Total |
The cumulative Total is the ongoing sum of all previous Cash Flow period’s Income, less Cost Totals. |
|
Cumulative Total including Advanced/Deferred Cost/Income |
This value is the combination of the Cumulative Total for a period and the Total value assigned to the period from both Cost and Income, coming from either Advances or Deferrals of past or future Cash Flow periods. |